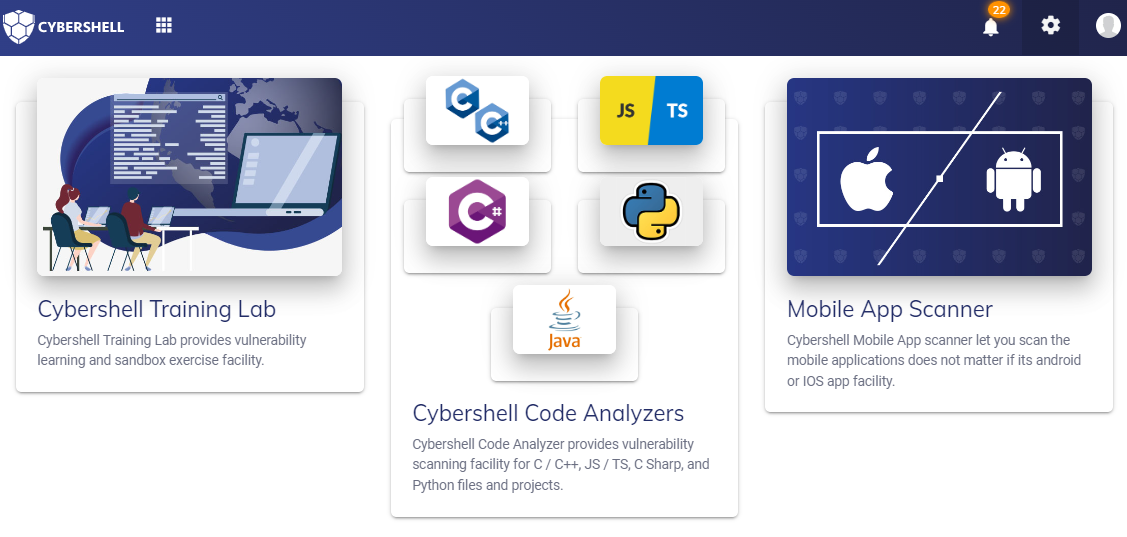
The main dashboard gives you the high-level overview of the state of your application and acts as a portal into various functionalities of the platform. It gives you immediate access to our multiple platforms such as training portal, cybershell code analyzers, and mobile app scanner.
Menu bar
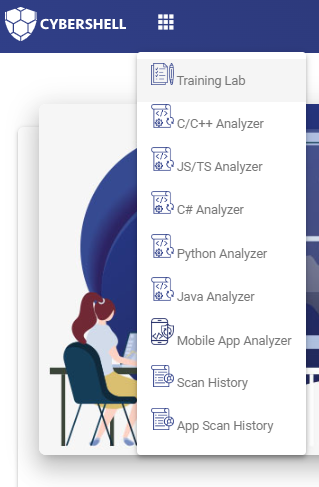
You can have direct access to options given on the current welcome page of cybershell by clicking the icon at the left top corner.
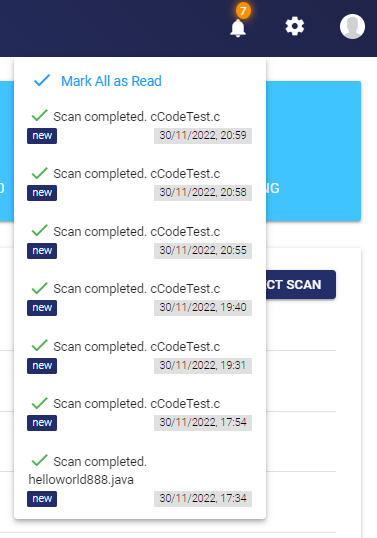
On the right top corner of the page there is a notification bell icon it tells about the last scans status. If an already given source code or project is done with scanning, its result will appear in the notification (as shown in figure).
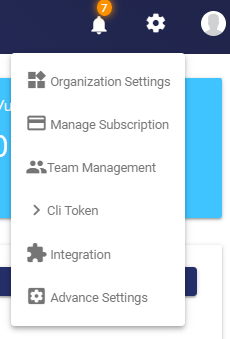
Beside the notification icon there is a setting icon for the user’s personal information. such as ‘Organization Settings’, ‘Manage Subscription’, ‘Team Management’, ‘Integration’ and ‘Advance Settings’.
Organisation settings
Coming soon
Scan history page
A complete history of all projects/source code and files being scanned can be visualised from the scan history page. The menu bar will remain the same as it was on the welcome page.
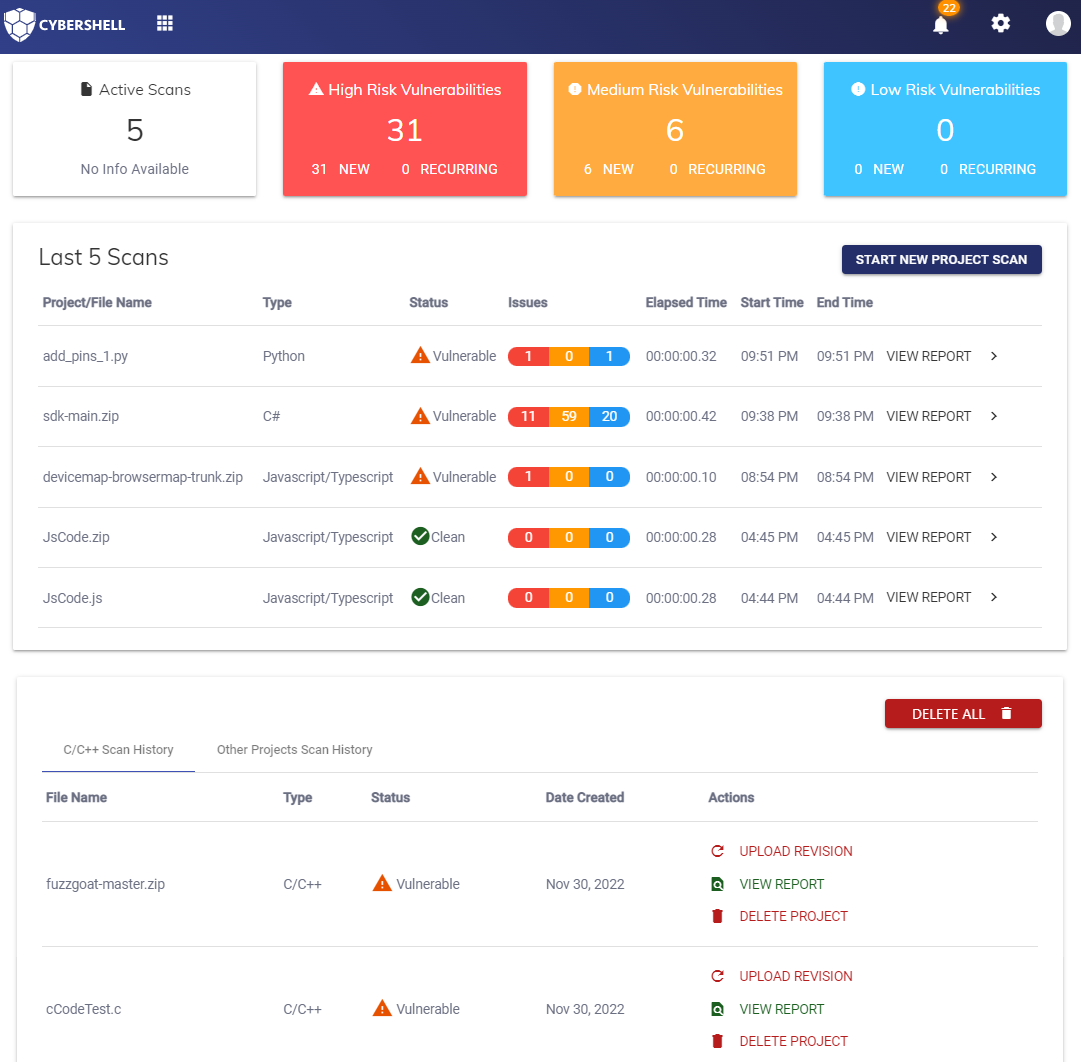
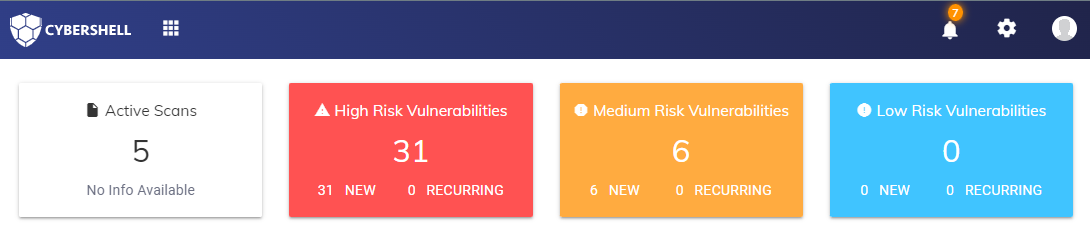
Statistics bar
It contains details about the active scans, total number of high, medium and low risk vulnerabilities recorded for the user logged in.
Active scans are those if there is any scanning found with pending status.
High, medium and low risk vulnerabilities tell about the total number of specific risk vulnerabilities found.
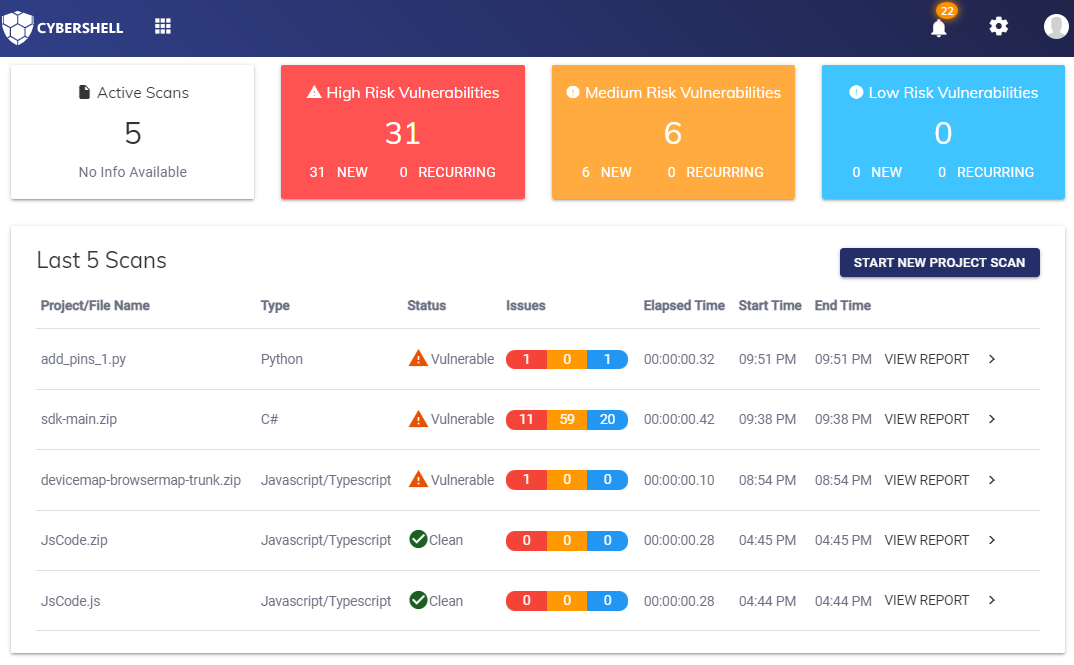
Last 5 Scans
This table gives description about the recent any type of (project scan, file or scan with source code) last 5 scans. It also gives information about the name of the file being scanned.
Name of file/project being scanned
Tells about the name of the project file (zip) or scanned code being scanned.
Language name
It might be one of these
C/C++
JavaScript/TypeScript
Python
C#
Java
Status of scanning
Pending
when scanning is going on at the backend.
Vulnerable
when our AI threat analyser find any type of vulnerability in scanned code
Clean
when our analyser finds that the given scanned project/source code is not vulnerable.
Syntax Error
when the analyser didn’t find some kind of vulnerability, but found some bugs, code spell, or syntax issues.
Issues
Issues gives the stats about the number of vulnerabilities found in specific project, file or source code. Number in red tells about the number of high risk vulnerabilities
Elapsed Time
Time taken by the analyser to scan a project/source code. It can record up to milliseconds.
Start Time:
It is the local time when the scanning is being started.
End Time:
Local time when the analyser is done with scanning of given project/source code.
Complete history
A complete history of scanning can be accessed at the bottom of the page (as shown).
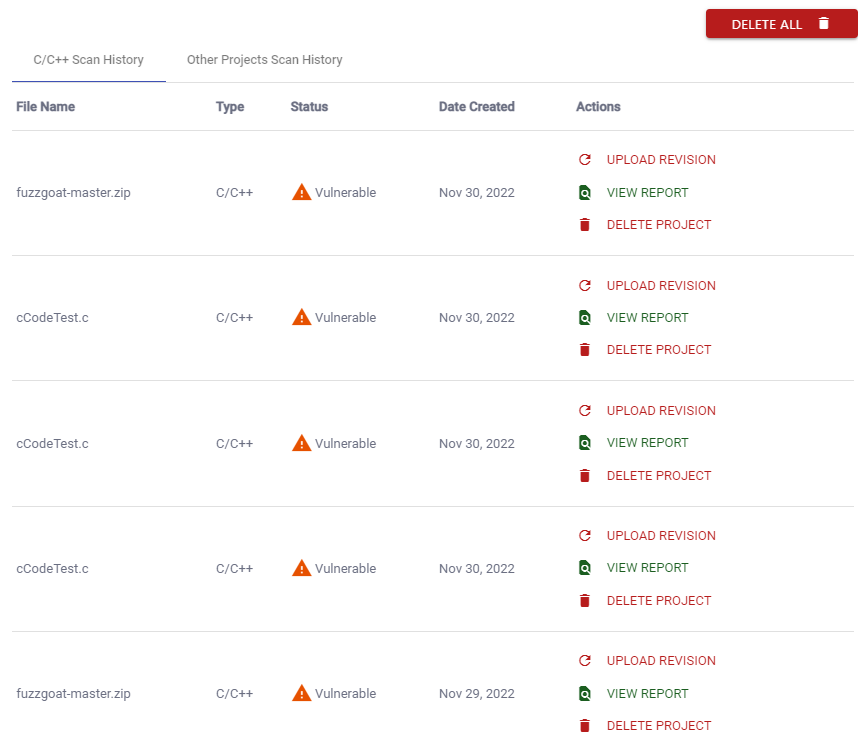
There are two types of complete history (shown in red dotted circle).
C/C++ Scan History
This tab will show you the history of scanned project/source code only for C and C++ language. Date of scanning of the project can be visualised. Furthermore, multiple actions can be done
Upload revision
On clicking, the system will take you to the home of the scanning page. From where you can rescan the project.
View Report
Scanned Report of project or single file can be obtained by clicking the view report button in actions.
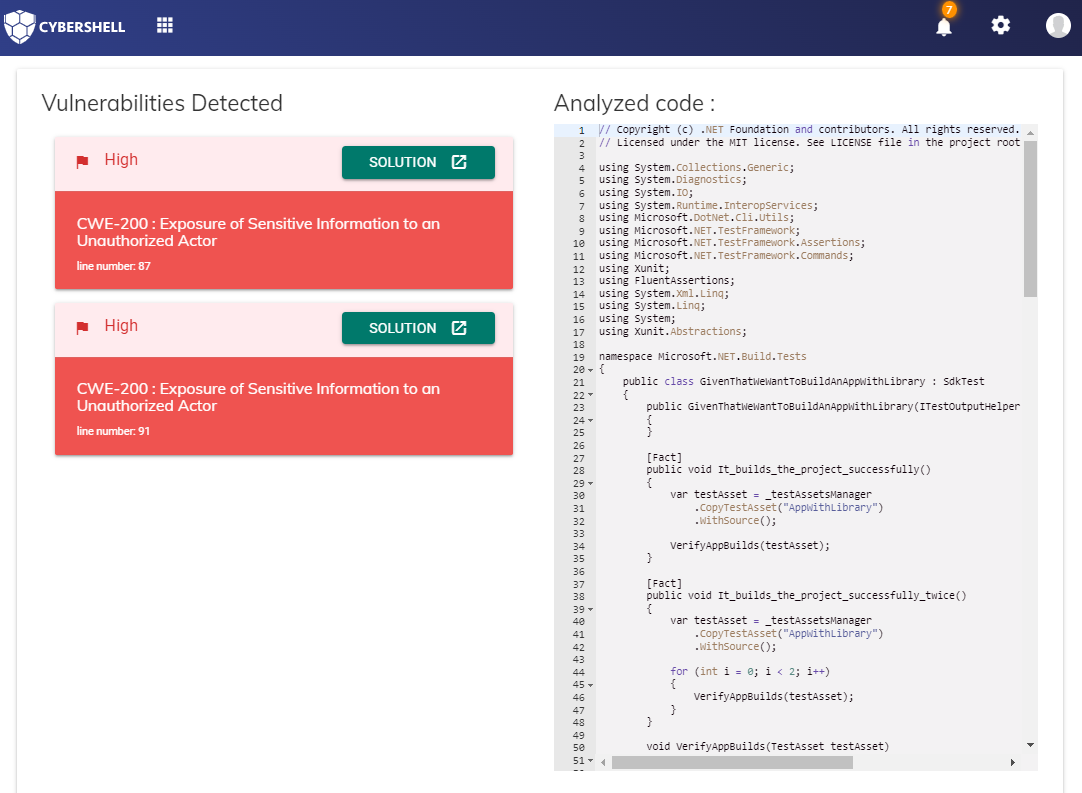
On clicking the view report, the detailed description of the scanned project view will appear (as shown).
Different number of vulnerabilities will be displayed in the pie chart according to its quantity along with its risks (high, medium and low).
Project vulnerability view:
It gives the visual description of the project and found vulnerability according to its finding within the tree of folder and subfolders.
In File Results it shows the Previous Scanned Vulnerabilities and Latest Scanned Vulnerabilities
In the action column, detail about the individual CWE-ID can be found. It can be visualised by clicking on VIEW DETAILS
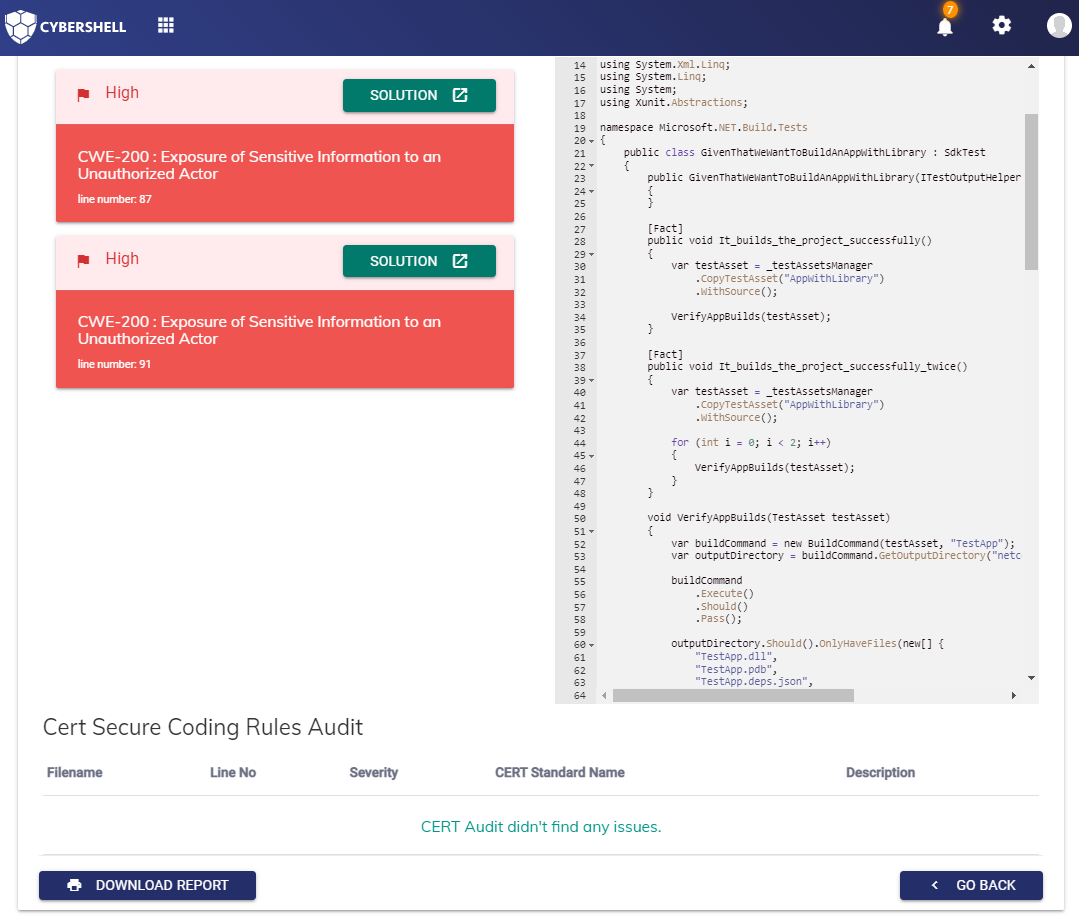
View details give the description of found CWE-ID and the analysed code (as shown). The line number for the founded CWE-ID can also be visualised here. Note: line number will be shown if the scanned code is not for language C/C++
Delete project
Scanned projects from scanned history can be deleted.
Other Projects Scan History
Details about all projects/source code being scanned for logged-in users can be downloaded here.
Note: Similar option will be there as in the C/C++ Scan history tab.